Rust Criterion Benchmark
title: Benchmarks With Rust date: 2023-11-05 12:00:00 -0600 categories: [programming,software] tags: [programming,hardware,software,rust,python] —
Optimize And Benchmark Rust Code With Criterion
Optimizing code is a crucial aspect of software development, and Rust provides a powerful combination of tools to help you achieve better performance. In this article, we’ll explore how to optimize a simple codebase using Rust, the Cargo package manager, and the Criterion.rs benchmarking library. We’ll use a sample code with functions f1, f2, f3, and f4, all called from a function named perf_bench.
Prerequisites
Before we begin, make sure you have Rust and Cargo installed on your system. If not, you can download them from the official Rust website. You’ll also need a code editor of your choice for writing Rust code. Install Criterion
Sample Code
Let’s start with a simple Rust code snippet based on the previous post for flamegraph exploration here:
1
2
3
4
5
6
7
8
9
10
11
12
13
14
15
16
17
18
19
20
21
22
23
24
25
26
27
28
29
30
  use core::time::Duration;
  use std::thread;

fn main() { // W: function `main` is never used
      perf_bench();
  }

  pub fn perf_bench(){
      for _ in 0..10 {
          f1();
          f2();
          f3();
      }
  }

  fn f1() {
      thread::sleep(Duration::from_millis(10));
  }
  fn f2() {
      thread::sleep(Duration::from_millis(20));
  }
  fn f3() {
      thread::sleep(Duration::from_millis(30));
      f4()
  }

  fn f4() {
      thread::sleep(Duration::from_millis(40));
  }
At this point we can perform a benchmark for the overall duration of perf_bench and compare against different code modifications.
Creating The Benchmark Test
In Rust, benchmark tests are created within a separate directory named benches. If you don’t already have this directory, you can create it in your project root. But for the purpose of this project you just need to specify where the benchmark is in the Cargo file add a new Rust file, such as benchmark.rs.
Add the criterion dependency in Cargo:
1
cargo add criterion
Then go to Cargo.Toml and add the library target, will see the following set of changes:
1
2
3
4
5
6
7
8
9
10
11
12
13
14
15
16
17
 [dependencies]
+criterion = "0.5.1"
+
+[profile.release]
+debug = true
+
+[profile.bench]
+debug = true
+
+[lib]
+name = "perf_bench"
+path = "src/main.rs"
+
+[[bench]]
+name="perf_benchmark"
+harness = false
+path="src/perf_benchmark.rs"
As you can notice there is a reference to a perf_benchmark.rs file which will have the benchmark that we want to run. It is required to use some criterion symbols and our perf_bench namespace to link against the perf_bench funtion that we want to benchmark. Notice that the benchmark function needs to be exported by specifing a lib target and a public function.
1
2
3
4
5
6
7
8
9
10
11
12
13
14
15
16
17
18
19
use criterion::{criterion_group, criterion_main, Criterion};
use perf_bench::perf_bench;

fn my_benchmark_function(c: &mut Criterion) {
    let mut group = c.benchmark_group("sample-size-10");

    group.significance_level(0.1).sample_size(10);
    group.bench_function("perf_bench", |b| {
        b.iter(|| {
            // Code to be benchmarked
            let _ = perf_bench();
        });
    });
    group.finish();
}

criterion_group!(benches, my_benchmark_function);
criterion_main!(benches);
Running The Benchmarks
Now that we have our benchmark tests set up, we can run them using Cargo. Open your terminal and navigate to your project’s root directory. To run the benchmarks, use the following command:
1
cargo bench
Here are the benchmark results before any optimization which we are taking as a baseline: 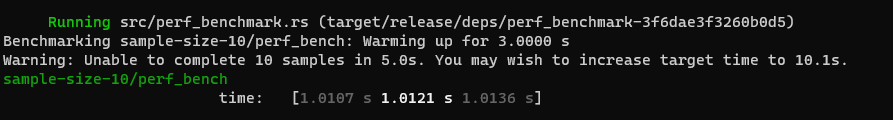
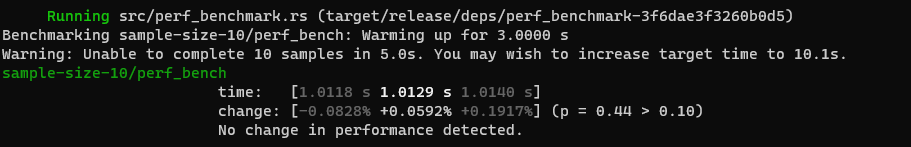
If we run it again is expected to not have any significant change as shown below:
Analyzing The Results
Benchmarking with Criterion.rs helps you measure the performance of your code and identify potential optimizations. In the case of benchmarking in a more granular fashion it could be determined that f3 and f4 are the functions that are taking most of the execution time. In general you can determine which parts of your code may need improvement by microbenchmarking parts of the code. In our example, the perf_bench function and its sub-functions are not benchmarked separately for conciceness, would be a good exercise to benchmark the different functions individually to get more familiar with the process.
Alternatively a flamegraph could be taken and reach the conclusion that f4 and f3 are the functions that are taking most time and therefore the overall execution would take more advantage from their optimization.
Measure The Optimizations
Once you’ve identified performance bottlenecks, you can work on optimizing your code. This might involve refactoring, using more efficient algorithms, or exploring multithreading or async programming for concurrent tasks. Re-run the benchmarks after each optimization to ensure you’re making improvements.
Remember that optimization should be guided by profiling and benchmarking results. Make sure to prioritize readability and maintainability while optimizing your code.
Let’s imagine the code was optimized and we are ready to benchmark our code again, the idea would be to simulate this kind of optimization by just cutting the sleep time of f4 and f3 to illustrate what the benchmark output will look like.
After all the process here is the baseline benchmark:

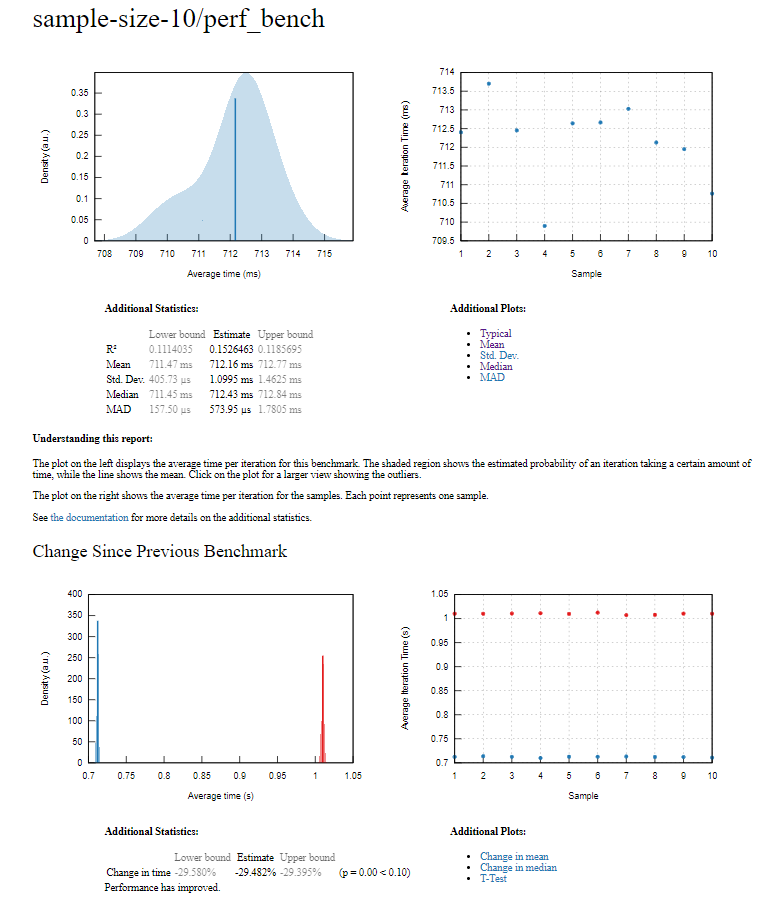
Finally, after all our efforts a 30% performance increase!
Conclusion
Rust, Cargo, and Criterion provide a powerful combination for optimizing code and achieving better performance. By benchmarking your code, you can identify areas for improvement and make data-driven decisions on how to optimize your software.
What was shown here is just the tip of the iceberg, Criterion provides statistics of the sample population that allow to account for outlayer data points and evaluate if the benchmark is throwing reliable data.
When working on performance you also would need to understand HW capabilities like performance peak, accelerators and ultimately what is the nature of the bottleneck in the application and hopefully now you have an additional tool to measure results.
Remember to visit the Criterion book. Also, if you want to explore in deep those details in your project, go to the target/criterion/report folder and will find some html reports like this:
References
Github code at: perf_bench
Additional Info benchmarking-rust-code-using-criterion-rs